
Telemetry BI: Mortgage Business Intelligence & Analytics Platform
Accelerate Your Company's Digital Transformation
Complement and complete your existing tech stack. Telemetry BI consolidates data from your lending origination software (LOS) and your accounting system into one platform. This unified view allows you and your branches to access your pipeline outside of your LOS. You can review and distribute financial reports (ex. P&Ls, break-even, cost-per-loan, and KPIs) without having to logon to your accounting system.
Decision-Making
Company Performance
Actionable Insights
Financial Reporting
Telemetry BI is a cloud-based, turn-key mortgage business intelligence and analytics platform.
It is the first mortgage lending BI solution to extract and integrate both financial data and
operational data from your accounting system and loan origination software. This unique approach
provides you with a complete view of your mortgage lending business via interactive dashboards, standard-of-practice
mortgage KPIs, branch-level P&L reports,
and more.
Built for mortgage lenders, bankers, brokers, branch managers, and CFOs, Telemetry BI is designed to save you time and achieve your business objectives.
Streamline your mortgage reporting process and discover new insights to can enhance profitability.
Facilitate data-driven decision-making to optimize your mortgage business.

Our turn-key approach is based on the MBA's top 100 metrics. This allows you to focus on improving your operations, understanding your financial outlook, and optimizing your pipeline instead of having to re-invent complex metrics and KPIs. Our clients have been able to save many days of work each month producing financial reports for their mortgage lending enterprise.
We offer configurable data extractors for all major accounting systems and loan origination systems (LOS).
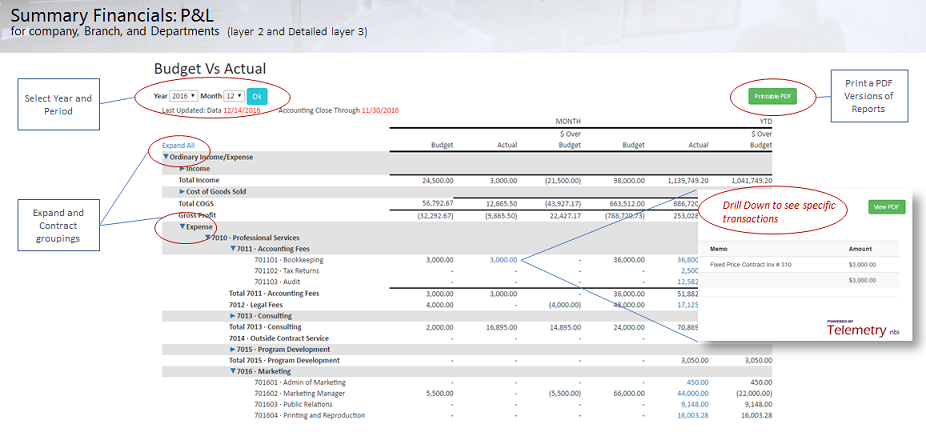
Our corporate and branch level P&Ls are based on your chart of accounts and are available 7/24 to
your branch managers in both dollars and basis points (BPS). These P&Ls are presented with trend indicators,
trend-line fly-outs, and budget vs actual indicators. Telemetry BI comes with a variety of other financial and
performance reports including predictive analytics, forecasting, and pipeline management.
Telemetry BI Features
- Daily Productivity
- Monthly Productivity
- Sales Funnels
- Pipeline Management
- Corp P&Ls
- Branch P&Ls
- Cost Per Loan (BPS & Dollar)
- Break-even
- Covenants Reports
- Balances Sheets
- Cash In Line
- Future Funding
- Compensation Analytics
- Expense Outliers
- Loan Originator KPIs
- Mortgage Processor KPIs
- Underwriter KPIs
- Funder/Shipper KPIs
- Loan Officer Ratings/Rankings
- Processor Rankings
- Underwriter Rankings
- Shipper/Funder Rankings
- Expenses
- Revenue
- Loan Details
- Corp
- Region
- Branch
- Future Funding
- Funding Trends
- Expense Trends
- Revenue Trends
- Corporate Executives
- Financial Controllers
- Accounting and FP&A
- Regional Managers
- Branch Managers
- Operations Managers
- Processors
- Underwriters
- Loan Officers
Telemetry BI Mortgage Lending Business Intelligence Platform
Telemetry BI is a mortgage business intelligence solution that integrates all aspects of a mortgage lender's operations and financial activity. It includes advanced analytics, predictive analytics, mortgage KPIs, financial metrics, branch P&Ls, and more in a single turn-key, cloud-based solution. Telemetry BI is the only mortgage business intelligence platform to offer financial and operational data integrated into one solution. All of this is offered in easy-to-use, visually compelling, interactive dashboards and reports.
What Is Mortgage Business Intelligence?
Mortgage business intelligence (BI) is the systematic collection, integration, and analysis of operational and financial data generated across a lending enterprise. Unlike general-purpose BI tools built for multi-industry use, a mortgage-specific platform is pre-built around the workflows, metrics, and data structures unique to residential and commercial lending — from origination and processing through underwriting, funding, post-closing, and secondary market delivery.
At its core, mortgage BI transforms raw data from your loan origination system (LOS) and accounting platform into structured dashboards, automated reports, and predictive models that executives, branch managers, and operations teams can act on in real time. The result is a unified intelligence layer that replaces disconnected spreadsheets and manual exports with a single source of truth accessible to every stakeholder across the organization — without custom development or an internal data team.
Why Mortgage Lenders Need Business Intelligence
Mortgage lending operates on margins that shift rapidly with rate cycles, regulatory changes, and competitive pressure. A 10-basis-point improvement in cost-per-loan — or a one-day reduction in cycle time — can materially impact net income across hundreds of loans per month. Yet most lenders still rely on manual reporting: pulling data from the LOS into Excel, reconciling it against accounting exports, and distributing reports that are already out of date.
The result is a decision-making environment characterized by lag, inconsistency, and blind spots. Branch managers cannot monitor their own P&L without involving accounting. Executives lack real-time visibility into pipeline risk. Operations managers cannot identify processing bottlenecks until they appear in funded volume weeks later.
Mortgage BI eliminates these gaps by automating data extraction, standardizing metric calculations, and delivering current, role-appropriate performance views to every stakeholder — without adding headcount or requiring custom development work.
Mortgage KPIs: The Metrics That Drive Profitability
Key performance indicators are the quantitative signals that tell a lender whether the business is moving in the right direction — and how fast. The Mortgage Bankers Association's benchmark studies track more than 100 distinct performance measures. For most lenders, the actionable core set spans four categories:
Production & Cycle Time KPIs
- Applications per loan originator per month
- Pull-through rate (application to funded loan)
- Loan fallout rate by stage and reason
- Average loan size by channel and product type
- Units funded per processor and per underwriter
- Average days: application to approval
- Average days: approval to clear-to-close
- Total cycle time vs. MBA industry benchmark
Financial & Operational KPIs
- Revenue per funded loan (BPS and dollars)
- Total cost per funded loan (direct and allocated)
- Net income per loan
- Origination expense ratio
- Gain-on-sale margin by product and channel
- Suspense rate and resolution time
- Underwriter conditions per file
- Repurchase and loan defect rate
Telemetry BI automates the calculation of 34 core performance measures directly from your LOS and accounting data, ensuring every user across every branch works from identical, current numbers — without maintaining a single KPI spreadsheet.
Branch Profitability: Real-Time P&Ls Without Calling Accounting
Branch-level profitability is one of the most analytically complex and operationally important challenges in mortgage lending. Every branch carries a different loan mix, compensation structure, expense allocation, and production volume. Understanding which branches are truly profitable — net of all direct and allocated costs — requires a P&L methodology that is both rigorous and consistently applied across the entire organization.
Telemetry BI builds branch P&Ls automatically from your chart of accounts. Revenue is allocated per funded loan using pricing and gain-on-sale data drawn directly from the LOS. Expenses — including compensation, benefits, occupancy, technology, and allocated corporate overhead — are mapped to each branch through configurable allocation rules tied to your actual general ledger structure.
The result is a branch P&L that branch managers can access 24/7, expressed in both dollars and basis points for direct comparability across branches of different production volumes. Trend indicators, trend-line flyouts, and budget-vs.-actual comparisons are embedded in every report so managers can identify performance shifts without waiting for the monthly accounting close. At the corporate level, branch P&Ls aggregate to regional and enterprise views using the same methodology, making it straightforward to benchmark branches against each other and against MBA peer data.
Cost-Per-Loan Analysis: Understanding Every Dollar of Production Expense
Cost per loan (CPL) is the single most closely watched financial metric in mortgage lending. MBA benchmark studies show total production costs exceeding $10,000 per loan for many lenders — a figure that encompasses personnel, occupancy, technology, secondary market costs, and corporate overhead allocations. Understanding the composition of CPL and how it compares to revenue per loan is essential to protecting margin.
Telemetry BI calculates CPL at both the corporate and branch level, in dollars and basis points, and breaks it down into its component cost categories. Direct personnel costs, variable compensation, technology expenses, and allocated overhead are each tracked separately so management can pinpoint where production costs are rising faster than volume.
CPL trend analysis is built into the platform — tracking how cost per loan has moved month over month, quarter over quarter, and year over year alongside funded volume. When production volume falls, CPL rises even if nominal expenses are flat, creating the margin compression that forces difficult staffing decisions. Telemetry BI surfaces this dynamic proactively so executives can act rather than react.
Mortgage Forecasting: From Reactive Reporting to Predictive Management
Standard mortgage reporting tells you what happened. Mortgage BI forecasting tells you what is going to happen — giving management the intelligence to plan staffing, capacity, capital, and expense in advance rather than reacting to results after the fact.
Telemetry BI's predictive analytics engine projects forward from current pipeline data, historical conversion rates, and seasonal funding patterns to produce short-horizon (30/60/90 day) and medium-horizon funding forecasts expressed in units and expected revenue. Forecasts update automatically as the pipeline changes, giving FP&A teams a continuously current view of production trajectory.
Revenue trend analysis shows whether current production levels are consistent with annual plan, enabling teams to revise budgets and capacity plans before variance becomes material. Expense trend analysis flags cost categories running ahead of forecast. For warehouse line management, future funding projections help treasury teams anticipate utilization peaks and communicate with warehouse lenders before liquidity constraints arise.
Executive Dashboards: Enterprise Visibility for C-Suite Decision Makers
Mortgage executives — CEOs, COOs, CFOs, and Chief Production Officers — need synthesis, not detail: the ability to see whether the enterprise is on track against plan, where risks are concentrated, and which levers are available to improve performance. Telemetry BI's executive dashboards are purpose-built for this audience.
What Leaders See at a Glance
- Enterprise-wide funded volume vs. prior period and prior year
- Revenue per loan and net income per loan vs. MBA benchmark
- Cost-per-loan trend vs. budget
- Branch performance rankings with profitability indicators
- Pipeline health: pull-through rate and fallout analysis
- Cycle time performance across origination, underwriting, and closing
Built for Every Leadership Role
- CEOs & COOs: enterprise performance and strategic indicators
- CFOs: financial metrics, cost control, and covenant compliance
- Chief Production Officers: pipeline health and originator productivity
- Regional Managers: branch rankings and performance benchmarks
- FP&A Teams: budgets, actuals, variance analysis, and forecasts
Every dashboard element is interactive. Executives can drill from the enterprise view to regional, branch, and loan-level detail without leaving the dashboard — and without involving accounting or operations staff in pulling reports. Role-based access ensures each user sees only the data appropriate to their scope of responsibility.
Mortgage AI: Intelligence That Learns from Your Data
Artificial intelligence embedded in the analytics workflow represents the next evolution beyond traditional dashboards. Mortgage AI applies machine learning models trained on lender-specific production data to identify patterns, anomalies, and opportunities that conventional reporting cannot surface.
AI-Driven Capabilities
- Anomaly detection: Automatic identification of expenses, cycle times, or conversion rates that deviate materially from predicted ranges
- Predictive pull-through: ML models that score pipeline loans based on historical conversion patterns for more accurate funding forecasts
- Expense outlier analysis: AI-driven identification of cost line items running above historical norms with drill-down to the transaction level
- Originator performance modeling: Predictive scoring of loan originator activity patterns that correlate with future production output
Embedded in Your Existing Workflow
Telemetry BI integrates AI-driven analytics directly into the dashboard and reporting experience — surfacing intelligent alerts and predictive signals in the same interface where managers already work. No separate analytics tool, no data science team, and no additional configuration required.
Alerts and notifications identify developing bottlenecks and margin risks so management can intervene early, before operational problems translate into financial results.
LOS Integrations: Your Pipeline Data, Automatically Extracted
The loan origination system (LOS) is the operational record of every loan in a lender's pipeline. It contains borrower data, product details, status history, pricing information, and key milestone dates that drive production KPIs and revenue calculations. Without a reliable, automated feed from the LOS, mortgage BI is fundamentally incomplete.
Telemetry BI provides configurable data extractors for all major loan origination systems, including Encompass, BytePro, Calyx Point, MortgageDirector, and others. These extractors handle the full complexity of real-world LOS data structures — including custom fields, product-specific logic, and status codes that vary by lender configuration. LOS data is extracted on a scheduled basis and loaded into the Telemetry BI data warehouse, where it is joined with accounting data to produce a complete financial and operational picture. No manual exports, no file drops, no IT projects required.
Accounting Integrations: Where Financial Truth Lives
Production volume from the LOS answers what loans are being originated. Financial data from the accounting system answers what those loans actually cost — and how much money the organization is making. A mortgage BI platform that integrates only LOS data cannot produce the fully loaded P&Ls and accurate cost-per-loan calculations that meaningful financial management requires.
Telemetry BI connects to all major accounting systems used by mortgage lenders, including QuickBooks, Sage Intacct, Microsoft Dynamics, and others. The integration extracts general ledger transactions, expense detail, and balance sheet data on a scheduled basis, reconciling it automatically with LOS production data to produce fully loaded branch and corporate P&Ls.
This dual integration — LOS plus accounting — is what makes Telemetry BI the only mortgage BI platform to offer financial and operational data unified in a single solution, eliminating the reconciliation gap that makes manual reporting so time-consuming and error-prone.
Common Questions About Getting Started
Is there a learning curve?
Telemetry BI is designed to be quick, simple, and effective. It is the easiest to understand mortgage business intelligence platform available. Dashboards and reports let you see how your business is performing at a glance, and users can drill down to transaction-level detail on their own — without encumbering accounting staff with questions. The platform is used daily by branch managers, regional managers, executives, and accounting staff of all technical backgrounds.
Does customization require extra time or resources?
No. Telemetry BI is a turn-key, cloud-based solution with out-of-the-box best practices based on the MBA's top 100 metrics — no risky do-it-yourself projects required. We provide configurable data extractors for all major accounting systems and loan origination systems, and P&Ls are automatically built from your chart of accounts. There are no implementation fees, no hidden costs, and no seat licenses. Everything — including implementation, hosting, support, and continuous report enhancements — is included in a flat monthly subscription.
Frequently Asked Questions: Mortgage Business Intelligence
What is mortgage business intelligence?
Mortgage business intelligence is the systematic collection, integration, and analysis of data from across a lending organization — including the LOS, accounting system, and other operational sources — delivered through automated dashboards, financial reports, and predictive analytics. Unlike spreadsheets or general-purpose BI tools, a mortgage BI platform is pre-built with industry-standard KPI definitions, P&L methodology, and LOS/accounting integrations, enabling deployment in weeks rather than months.
What KPIs should mortgage lenders track?
Mortgage lenders should track KPIs across four categories: production metrics (applications per originator, pull-through rate, fallout rate by stage), cycle time metrics (application to approval, approval to clear-to-close, total cycle time), financial metrics (revenue per loan, cost per loan, net income per loan, gain-on-sale margin), and operational metrics (suspense rate, underwriter conditions per file, post-closing exception rate). The MBA benchmarks more than 100 measures; most lenders focus on 30–40 core KPIs tracked consistently over time.
How does mortgage BI differ from standard business intelligence?
Standard BI tools require significant configuration and custom development to handle a mortgage lender's data structures. Mortgage-specific BI is pre-built with industry-standard KPI definitions, P&L logic, and LOS/accounting integrations already in place. A mortgage BI platform can be deployed in weeks, requires no internal data engineering resources, and delivers best-practice metrics aligned to MBA standards out of the box — without the cost, risk, and timeline of a custom build.
What data sources are required for mortgage business intelligence?
The two essential data sources are the loan origination system (LOS) and the accounting system. The LOS provides pipeline and production data — loan details, status history, pricing, and originator activity. The accounting system provides financial data — general ledger transactions, expense detail, and balance sheet data. Together they enable fully loaded P&Ls and accurate cost-per-loan analysis. Additional sources such as CRM, pricing engines (PPE), and rate lock data can be integrated to further enrich the analytics.