
Real Estate Business Intelligence
Real Estate Office and Agent Productivity
Office and agent productivity should be compared on stated measures such as sides, sales volume, and Company Dollar. A ranking shows production. The office P&L shows contribution.
| What to know |
|
|---|
Productivity needs a shared definition
An office or agent looks productive only against a stated measure: sides, sales volume, Company Dollar, or a trend in those measures. Rankings are useful when the definition is the same for every person and office being compared.
Offices and agents answer different questions
| Level | Useful comparison |
|---|---|
| Office | Which locations are producing sides, volume, and Company Dollar? |
| Agent | Who is producing, and is that production broad or concentrated? |
| Listing side and buyer side | Is the production mix changing, not just the total? |
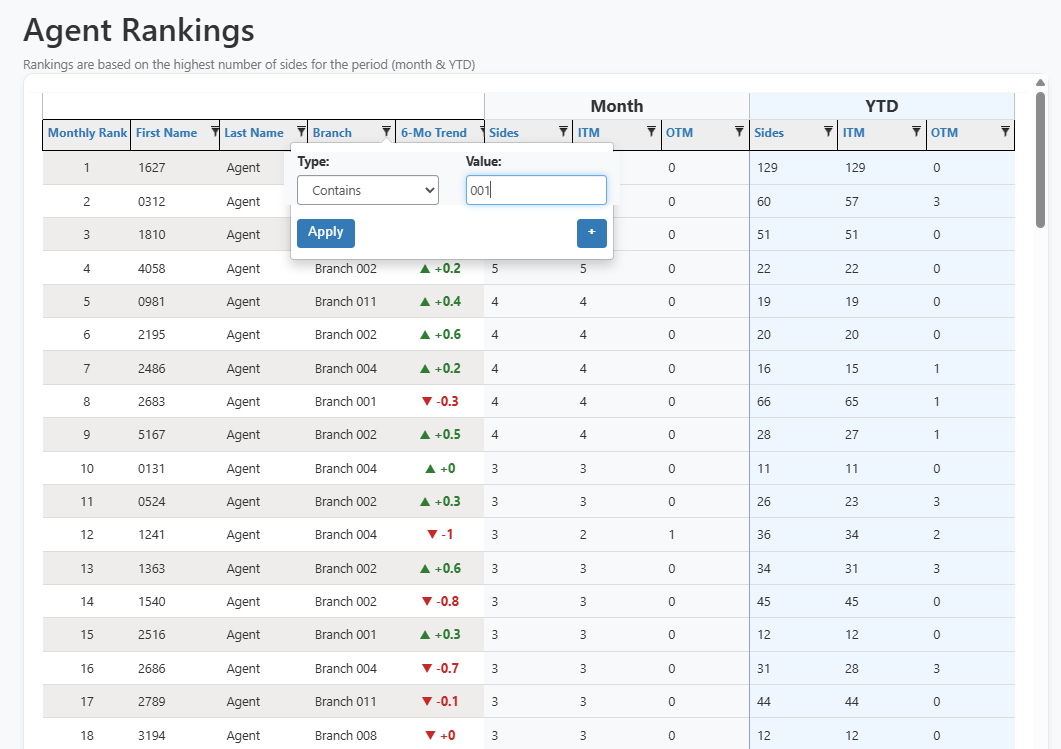
Telemetry BI can analyze agent production with sides, sales volume, Company Dollar, listing-side versus buyer-side activity, productivity trends, and rankings. Executives and managers can move from the enterprise and office view to an individual agent without keeping a separate ranking spreadsheet.
Do not stop at the ranking
A high-volume agent may be near a commission cap, which changes the Company Dollar on later transactions. A high-volume office may still be unprofitable after expenses. Read productivity with the office P&L and cap information before treating a ranking as the financial result.
Continue with brokerage profitability.
More from this category: Real Estate Business Intelligence articles.