
Mortgage Business Intelligence
Mortgage Loan Officer and Branch Performance Analytics
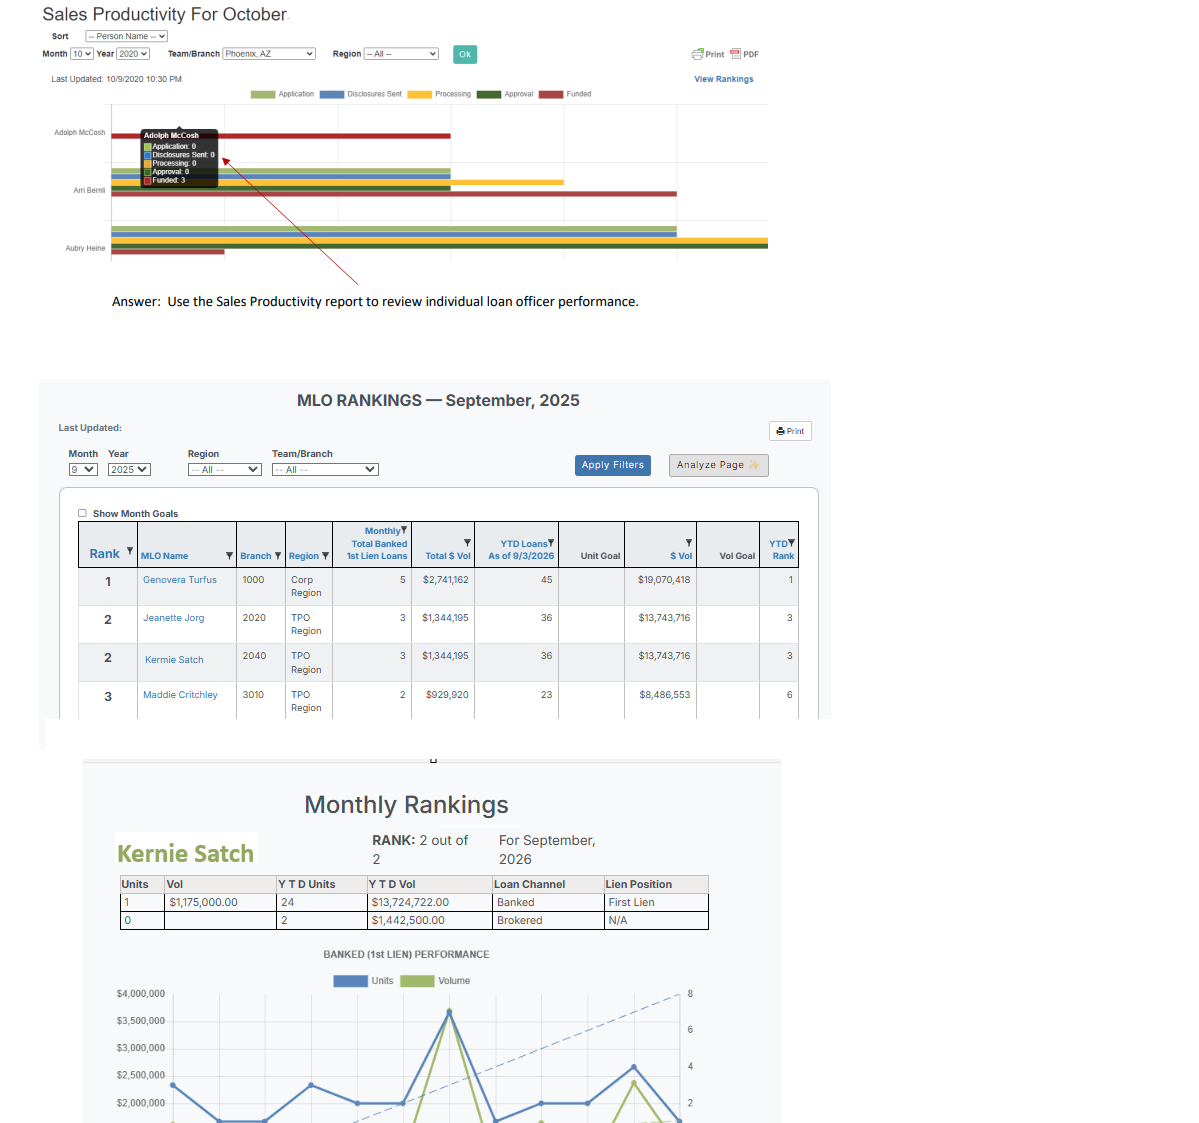
Loan officer and branch productivity should be compared with one definition of applications, fundings, and volume. Rankings show who produced. The branch P&L shows whether that production contributed.
| What to know |
|
|---|
Productivity is a comparison, not a ranking by itself
A loan officer or branch is productive relative to a defined measure and a peer group. Units funded, dollar volume, and applications per originator can tell different stories. The management question is which people and locations are producing, and whether that production is profitable enough to keep.
Separate activity from results
- Applications show effort entering the pipeline.
- Funded units and dollars show completed production.
- Pull-through shows how much application activity becomes funded loans.
- Branch profit and loss shows whether that production covers the branch's costs.
Rankings are useful when every person is measured the same way. They are misleading when one report uses locks, another uses fundings, and a third uses a manually edited list.
What managers can review
Telemetry BI includes loan originator KPIs, scorecards, and loan officer rankings, along with processor, underwriter, and funder or shipper rankings. Branch and regional views let a manager compare locations without exporting a new file for each one. Role-appropriate views are part of the platform's audience design: executives, regional managers, branch managers, and loan officers do not need the same starting page, but they do need the same definitions.
A practical review order
- Sort funded units and volume for the current period.
- Check whether the leaders are the same people as last period.
- Look at pull-through before treating low volume as low effort.
- Open the branch P&L before treating high volume as high contribution.
Related reading: mortgage production analytics and branch profitability.
More from this category: Mortgage Business Intelligence articles.